
There’s this moment every trader has. You’re staring at your chart — candles, lines — and deep down, you know something’s missing. The market moves, twists, and coils like a living thing. You want to catch it. You need to understand it. But the more you add to your chart, the more it feels like noise. Then, one day, you stumble across it. It’s not the flashy RSI. Not the mysterious MACD. Not even the big, bold moving averages. No, it’s this weird little indicator called Bollinger %b.
Let me tell you about Bollinger %b. Not from the textbook. But the way I feel it, the way it speaks to the rhythm of the market when you’re trying to survive in the chaos. And if you’re like me, that journey doesn’t end at the chart — it continues through backtesting in Excel, where numbers meet intuition and the strategy either proves itself or falls apart.
What is Bollinger %b? The Formula
So, let’s get the basics out of the way first, fast and dirty.
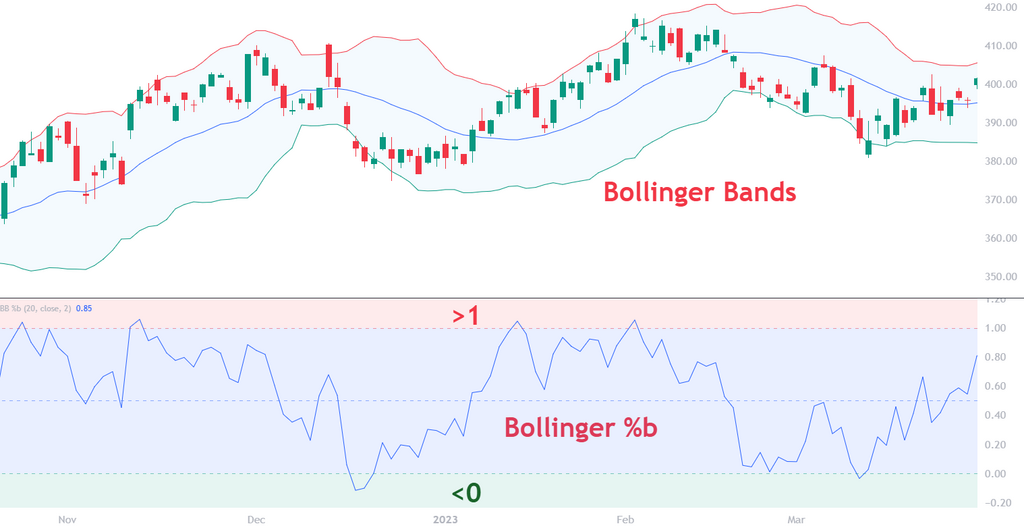
Bollinger %b takes the price and tells you where it sits between the upper and lower Bollinger Bands. Not just “is it above or below” but how far up or down it is inside the bands.
Here’s the formula behind Bollinger %b:
%b = (Price – Lower Band) / (Upper Band – Lower Band)
That’s it.
It’s just a normalized value showing where price is inside the bands.
- When %b is 1.0, the price is touching the upper band.
- When it’s 0.0, the price is touching the lower band.
- At 0.5, it’s smack in the middle.
- If it’s above 1.0? Price has blown past the upper band. Danger? Opportunity? Both.
- Below 0.0? The same, but in reverse — maybe a panic sell-off or a golden long.
Sounds simple, right? But this is where things get interesting.
The Emotions Inside the Indicator
You can feel Bollinger %b.
No, really. It’s not just a calculation. It’s the heartbeat of the market. Think of it this way: when a stock is riding up to the upper band, %b creeps toward 1.0. The higher it gets, the more tension builds. Like a balloon inflating. Traders pile in, prices push, emotions get hot.
And then boom, %b breaks above 1.0. It’s not just a number — it’s euphoria. But euphoria doesn’t last forever, does it?
That’s the trap.
Most traders get seduced by price breaking out of the bands. They buy the breakout without checking if %b is whispering, “Hey… we might be overcooked.” And when that price slams back inside the bands? Yeah. That’s the regret moment.
But if you’ve got %b on your screen, you see it. You feel the overextension. It’s like looking at a party that’s about to get shut down.
The Real Power of Bollinger %b. The Strategies
Once you stop chasing and start listening, %b becomes this whispering guide. It doesn’t shout. It doesn’t flash signals. But it says, “Hey… we’re getting a bit hot.” or “This might be bottoming out.”
Here’s how I use it now:
1. Mean Reversion Signal That Just Make Sense
When %b drops below 0.0, the price is outside the lower band. That doesn’t mean it’s time to buy yet — but it means look closer. Maybe you pair it with RSI. Maybe price is near a support zone. Maybe the volume is drying up.
When all those things line up and %b starts to crawl back toward 0.0? That’s when I get chills. Because often, it means a snap-back is coming. The market overdid it. Now it’s time to revert.
Same for the top.
2. Breakout Confirmation (When You Need Confidence)
Sometimes price pushes above the upper band and %b breaks 1.0… and keeps climbing. That’s when you lean forward.
It’s like %b is saying, “Okay, this is real.” You don’t want to chase blindly, but if you’ve got the volume, the momentum, and a strong trend behind it? That’s a breakout you can trust.
3. Context in a Crowded Chart
If you already use Bollinger Bands, RSI, MACD, whatever %b gives you clarity.
Instead of trying to guess whether price is “too high” or “too low,” %b shows you, numerically, where it stands. No guessing. Just clean signals that plug into your brain and say, “Here’s where we are. Make your choice.”
Why Don’t More Traders Use Bollinger %b?
Let’s be real. The name is weird. The line is flat. There’s no dramatic crossover or colorful histogram. You can’t brag on Reddit, “Just made 20% using Bollinger %b!” — no one even knows what you’re talking about.
But that’s exactly why it works.
Bollinger %b flies under the radar. It doesn’t suffer from the herd effect. It’s a quiet indicator for traders who are tired of noise. And if you really want to separate yourself from the crowd, you don’t need more lines. You need better insights.
Bollinger %b gives you that.
Emotions, Psychology, and the True Use of Bollinger b
Let me tell you something no one says out loud.
Every indicator you use is just a reflection of trader behavior. Indicators don’t predict the future. They mirror human emotions—greed, fear, hesitation, panic.
And Bollinger %b? It’s a direct window into how stretched the crowd is.
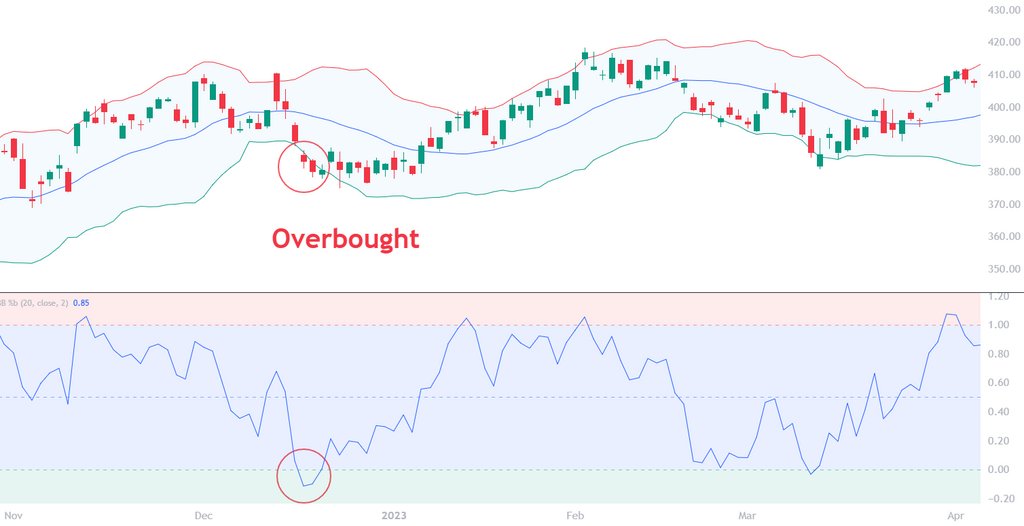
When Bollinger %b is near 1.0, everyone is greedy. They’re buying late, thinking it’ll go on forever. That’s a moment for caution.
When %b is under 0.0, people are terrified. Selling in a panic. That’s when I start to get interested.
%b helps you stop being the panicked crowd and start being the one who sees through it.
And if you really want to trust it, not just feel it — backtest it. Let the data show you how crowd emotion plays out again and again.

Free Backtesting Spreadsheet
How to Calculate Bollinger %b in Excel or Backtesting
If you’ve ever stared at Excel wondering how to turn it into a trading lab—welcome to the club. The good news? Bollinger %b is one of the easiest indicators to calculate and doing it in Excel gives you complete control. You see every number, every formula. No black boxes. Just raw, honest math.
Here’s how you can do it:
Step 1: Get Your Price Data
You need at least the closing price for each trading day (or hour, or minute, whatever timeframe you’re working with). That goes in one column—let’s say Column E, starting from E2 downward. In this particular spreadsheet I use SPY ETF price data from investing.com.
Step 2: Calculate the Simple Moving Average (SMA)
Pick a period. Most traders use 20. Set this value in cell K1. In Column H, you calculate the 20-period SMA:
=AVERAGE(INDEX(E:E,ROW()-$K$1+1):INDEX(E:E,ROW()))
Drag that down the column so it updates for each row.
Step 3: Calculate Upper and Lower Bollinger Bands
In Column F, get the upper band:
=H21 + ($M$1*STDEV.S(INDEX(E:E,ROW() – $K$1+1):INDEX(E:E,ROW())))
And in Column G, get the lower band:
=H21 – ($M$1*STDEV.P(INDEX(E:E,ROW() – $K$1+1):INDEX(E:E,ROW())))
M1 cell includes multiplier which is useful for volatility adjustments.
Step 4: Calculate Bollinger %b
Now the magic. In Column I, calculate Bollinger %b with this formula:
= (E21 – G21) / (F21 – G21)
This tells you exactly where price is between the bands. When %b is above 1.0, price is above the upper band. Below 0.0? It’s fallen outside the lower band. Clean, intuitive, and insanely useful.
One Quick Note on Errors
You’ll get error cells in the first 19 rows, because there’s not enough data to calculate a 20-period average. That’s normal. Just start your analysis from row 21 onward.
How to Backtest with Excel
You can download Excel template for Bollinger %b with all the steps above already done. Then include it in backtesting spreadsheet. How? Watch the video:
Final Thoughts
I used to think trading was about knowing everything — predicting the future, outsmarting the market, having the perfect setup.
But the more I traded, the more I realized something deeper. Trading is about understanding pressure. Emotional pressure. Technical pressure. Crowd pressure.
Bollinger %b doesn’t try to predict. It just shows you where the pressure is peaking.
That’s powerful.
It helps you avoid buying when everyone else is already in. It helps you buy when everyone’s too scared. And most importantly, it helps you wait when the market is breathing, coiling, waiting for something big.
So yeah, maybe it’s not the flashiest indicator on the block. But it’s one of the realest. And once you start using it, you’ll wonder how you ever traded without it.
Share on Social Media:
FAQ
What is the best setting for Bollinger %b?
There’s no perfect setting that works for everyone. The classic combo—20-period SMA with 2 standard deviations. But here’s the truth: the best setting is the one that fits your strategy and personality. Try a few, backtest them, and see what feels right. You’re not trying to copy someone else’s rhythm — you’re trying to find your own.
Can I use Bollinger %b for intraday trading?
Absolutely. In fact, some of the cleanest %b signals show up on the 5-minute and 15-minute charts, especially around news events or market opens. Just tighten your settings if needed (maybe a 14-period SMA), and be quick on the trigger. Intraday trading with %b is like surfing: you’ve got to read the wave, not fight it.
What is the best strategy with Bollinger %b indicator?
A classic strategy is to fade emotional overreactions. Buy when %b dips below 0.0 (panic), and sell or short when it flies above 1.0 (greed). But it doesn’t stop there. Just remember: the best strategy isn’t the one that sounds cool. It’s the one you’ve tested, refined, and trust with real money.
How do I know if Bollinger %b is working for my strategy?
You don’t guess—you test. Backtesting is your truth serum. Run your strategy on historical data. Check how %b behaved before your entries and exits. Were the wins consistent? Did it help you avoid bad trades? Don’t just rely on “it looks good on a chart.” Put it through a real test.


Leave a Reply